Friday, December 10, 2010

Will PM's get the steep correction?


My favorite guru uses the cycle theory to predict movement in PM prices (gold and silver prices). According to him, the PM market is due for a steep correction. How steep? He pegs gold to go back to 1,350 (maybe even a hundred lower) and silver correcting back to maybe as low as $22/oz. Then he made a strange statement. Unless silver corrects back, it won't move beyond $30.
I am not privy to his formulas. He was correct in his long range forecast, but he keeps repeating the forecast for the steep drop. So far, it has not happened. But it could happen. Still, forecasters should do like weathermen and look out the window.
I have collected silver and gold prices that go back to August this year. Both graphs show an almost straight line change till mid October then volatility increases. Furthermore, the rate of change of gold prices slowed, while silver prices continued. Is this meaningful?
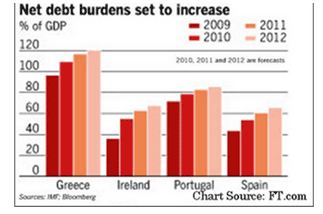
Let's look at the fundamentals then. 1. The European debt crisis continues and if the papering over shows cracks, Europeans will again buy dollars which might drop gold prices for a while. 2. The FED is continuing the printing of money. Of course, the printing has been reduced to punching computer keys, but the result is the same, adding money to the money supply. Potentially, this could be as much as $6T or even more. 3. The fundamentals of the US economy are being still devastated by Obama and the Democrats. The latest example is the political maneuvering over the expiration of tax rates in place since 2003. Obama refers to efforts to maintain this level of taxation as "tax cuts for the rich." In what has been dubbed as an abrupt about face, Obama agreed to an extension of these rates for two years in exchange for extending unemployment and reducing Social Security witholdings. Some people believe that Obama was setting up a hoax in order to discredit supply-side economics. The idea that maintaining the same tax rates is a "tax cut" is a hoax, since there is no change from the current level of taxation, except that inheritance taxes will go from zero to thirty five percent. In any case, members of the Socialist Party (Democrats) reacted violently and the Dem caucus in the House has voted to defy Obama. So, here we are facing the Dec 15 witching hour. Will people dump stocks (including PM miners) anticipating a rise in taxes on cap gains?
So, while technicals do not forecast a drop in gold prices, fundamentals are uncertain. The feeble attempt by Obama to try to emulate Bill Clinton's move to the mythical "Center" is a sham. He remains a Marxist and a foe of Capitalism.
All this uncertainty is having a good effect: the Dem's Dream Act of registering millions of Hispanic Democrats has been shelved by the Senate along with the repeal of "don't ask don't tell." At least for the while. Dingy Harry Reid is a treacherous bas...d and can renag on promises at a drop of a hat.
So, here we are. Will we see a drop in gold?

Tuesday, December 7, 2010

Nesze semmi, fogd meg jol.

The Great Tax Compromise of 2010 between Republicans and the Obama regime is already ballyhooed by the financial Press as leading to growth. Of course, Liberals believe that giving people unemployment creates economic growth, so we can not expect better from them than to expect cutting Social Security taxes to do the same.

Markets responded with a yawn.

Why would this not work? The title tells the story in Hungarian. Roughly translated it means: 'here is nothing, hold it tight!' In essence, there is very little here that would cause growth. Keeping current tax rates simply maintains things as they are. Reducing Social Security taxes is not that different from giving people $500 that failed to grow the economy. And contrary to the firmly held belief of Pelosi and her minions, giving people money for doing nothing does not grow the economy either. Still, this compromise will do one thing: INCREASE THE DEFICIT.

Nothing in this package is a supply-side tax cut. Nothing in this package will grow the economy.

Friday, December 3, 2010

Economic idiocy.

The Media is doing everything it can to extend the power of the defeated Democrats in Congress. As usual, they are clueless about how the economy works. Democrats want to allow the tax cuts of the Bush area to expire and raise taxes by doing so. Especially tempting for them is to raise taxes on upper earners making more than 250,000 a year. They refer to this as "tax cuts for the rich." In reality, Republicans are fighting to preserve CURRENT TAX RATES.

Most small businesses file their tax return as sub chapter "S" returns and so the overwhelming majority of incomes above $250,000/year represent small business income. Raising taxes on that would automatically prolong the Recession. That is not all the harm that would come from raising taxes now. The Stock Market would take a big hit, because if the current tax rates are allowed to expire, capitol gains would go from 25% to 30%. Why would that be bad? Because Investors would sell their stocks now (before TAX RATES WENT UP), precipitating a Stock Market retreat.

SenateRepublicans pledged to filibuster anything the losing Dems want to bring up unless the current tax rates are preserved. The Media refers to this as "holding the Nation hostage," as if the losers of the last election are entitled to slip in one more dose of their idiocy before they get out of town.

What idiocy - you say. Read the AP story dated Nov 30. It echoes Nancy Pelosi that unemployment compensation grows the economy. They cite figures that every dollar spent on unemployment cause $1.6 growth in the economy. No wonder the recession goes on and on.

Thursday, December 2, 2010

Will we, won't we?


Many financial analysts are constantly predicting two things: 1. a robust economic recovery and 2. a drop in gold prices. I would expect that analysts would set up a clamor now when gold prices are showing a head and shoulder pattern(first graph).

At first glance, the head and shoulder pattern is fairly clear, with the head forecasting a &90/oz drop in gold price. Only the second look makes you wonder. Why? Because the neck on the right did not form properly and the pattern is being drawn out into a simple correction that is nearly over. This is even clearer with silver (second graph). Silver prices simply hiccuped and continue to rise after the correction.
Yesterday's action in gold and silver miners also deny the existence of a sharp correction. Today's action is mixed. The dollar is again pushing 82, but oil finally has cracked through the 85 level and is coming up on $87/bbl. Inflation is beginning to mount a show.
What is a likely scenario is that investors are beginning to lose their fear of another (double dip) recession and have increased funds going into the Stock Market. Gold prices, meanwhile, are consolidating while silver prices continue to rocket higher. With each day of gold staying close to $1400/oz, the chance of a big correction (signalled by a head and shoulders pattern) is diminished. And another rally could push gold to new highs, above $1422.

Thursday, November 18, 2010

Gold and silver: are we there yet?


Every time gold prices take a correction, we hear the chorus that we are in a gold 'bubble" that is about to burst. The chorus continues until the correction is over, abates, then restarts when gold takes its next drop. The chorus is even louder when it comes to silver prices.
The first graphic purports to show a "parabolic" rise in silver, the final proof of a bubble in some eyes. When I get a plot for silver prices, the price rise is steep but not parabolic(second graph down). Even more revealing is the third graph, the gold price. Since, last November, gold has traded in a rising channel. No runaway bubble there. Compare the rise in gold prices to the previous graph: while gold has started the current channel in November, the rise in silver began in August this year. Until then, shorts were keeping silver prices almost even. So, now silver prices are pushing hard. Also, the occurrence of silver to gold is 14 to 1 in the ground, so for many years gold ran 15 times higher than silver. The ratio of gold to silver got as high as 60. Clearly, silver prices were being suppressed.
The biggest reason for the rise in precious metals is the money printing across the world, especially in Europe and the US and Japan. Yes, we have a fear of inflation as well, but it is the Central Banks and our FED that are ruining the fiat currencies.
The FED is starting QEII with a 600 Billion purchase of Treasuries that is supposed to goose the economy and lower interest rates. Instead, we see municipal and Treasury bonds yielding more in interest, forced on the bond issuers, because of the value of the Dollar is dropping. Strange that Helicopter Ben is still 'surprised' every time one of his schemes do not work out.
The last graphics is a description of what happens in a gold bubble. We have yet to see the Public become enthusiastic.
The best guesstimate is that gold will reach $5,000/oz between now and next August. Sometime, between now and then, gold will start moving fast. The current rally is small potatoes.


Tuesday, November 16, 2010

Update on gold and the debt crisis.


The two graphics I posted should explain the basics of the debt crisis in the world. It's like this: not enough producing, too much spending and too much borrowing. It is the nightmarish end of Social Democracy: endless government subsidies and spending to buy votes.

The first graphic shows the borrowing needs of selected Western countries as percentage of GDP. We can see that these rates are not sustainable. In the case of Japan, the government borrowed the money its citizens saved, so when Japan goes belly up, its citizens will lose all their savings. The US borrows most of the money it spends from all over the world (including China). This year, the FED is going to do "Quantitative Easing #2, or QEII, a nice way of saying printing money. We will 'pay' for it in the coin of inflation and the dollar losing its reserve currency status.
The second graphic is the increasing debt burden of the PIIGS countries. Notice that in spite of the spending "cuts" promised, debt continues to swell.
How do these countries get into the pickle of unsupportable and escalating debt? It began with the promises of the Social Democrats to provide for various government services to the population. At first, they raised taxes, especially on the high earners. These were the people who knew how best to invest money in profitable ventures and increase the GDP. When their earnings went to the government in the form of taxes, the high earners reduced their taxable earnings. Down went the GDP and down went the taxes collected. The Media is Socialist all over Europe and it defends every government program just as fiercely as it does in the United States. Opposition Conservatives became "me too" politicians and after a while it made no difference who got elected; government programs and subsidies continued and so did deficit spending. As the private economies grew anemically, an ever larger amount is being financed from borrowing.
So, where is the problem, a Social Democrat might ask. The problem comes when investors (those who buy the debt) decide that with larger debt, the risk of default grows and demand larger return on the borrowing needed to roll over old debt due for repayment. At some level of interest demanded, the debtor can not pay and default looms.
This creates a problem for all who own debts by the deadbeat. If the deadbeat defaults, all of its loans might be declared unpayable and pyramiding of debts stops. Hidden to the population of Europe is the fact that these countries owe large sums to each other and if one gets caught in a default, it will be come a "contagion," a serial default as one country after another admits that it can not pay its debts. That is why the EU decided to bail out Greece and is now considering bailing out Ireland and Portugal, with Spain looming on the horizon.
With the debt crisis comes another unexpected surprise: a surge in the price of the dollar, as deluded people try to convert their Euros into a "safe" currency, the US Dollar. And that raises the value of the dollar, depresses oil, gold and silver prices. Permanently? Oh NO!! When the Europeans paper over their latest currency "crisis" the dollar will again sink and gold, silver and oil will soar.
More on this correlation later.

Thursday, October 28, 2010

The first game of the World Series.

This is an unusual year. So, it should not surprise us that we are having an unusual World Series. The ascendency of San Francisco and the Texas Rangers into the series stunned the East Coast crowd that expected (and wanted) the Yankees and the Phillies. But it was not to happen.

The first game was viewed by the East Coast pundits as a pitchers' duel. Low scores were expected. And it began as if the pundits were right for a change as Texas went ahead two to nothing. Then in the span of a few minutes SF scored six runs and the Texas pitcher (unbeaten untill then) was not only beaten but out of the game. That was not the end of the story. By the time of the final out, the score was eleven to seven.

On to tonight's game.

Saturday, October 23, 2010

Volatility.

Since, I have posted about a small correction, the end of it, then an even bigger correction, what gives?

The gold price and the gold market has entered a time of volatility. That is self-evident. But why?

It is not hard to point at possible culprits, but we won't know until someone blows the whistle and publishes the data. Is the FED trying to reduce gold prices (and up the Dollar) to convince the electorate that everything is all right? Or, are the Chinese selling gold to thwart the FED in lowering the value of the Dollar and for an upward revaluation of the Yuan? Or, are gold traders taking a profit and pushing down the value of gold so they can buy more at cheaper prices? Hard to know at this point.

Nov 3 will be an important day. We might know the election results and will begin to see the Market's reaction to it. And we will know (maybe) the outcome of the FED's meeting on Nov 2. Will we get some idea on QEII and its size? Will the FED buy up the 13% of houses in foreclosure or waiting for foreclosure?

Investors know the score, they just don't want to believe it. The FED made it clear that they want more inflation, more money printing. Deficit spending continues. Money printing continues. Gold prices will rise to yet new records.

Thursday, October 21, 2010

Gold: correction under way.

My favorite analyst has warned about a coming $100 dollar correction in gold prices and the correction arrived like a thief in the night. Simultaneously with the drop in gold, the Dollar went up and oil dropped a couple of dollars.

HOWEVER! Gold miners are dropping slower and silver miners are resiting downward pressure. Oil prices recovered some and the Dollar is howering a little over 77. The correction might be of uncertain size at present.

Why is gold dropping? The culprit is probably the FED, trying to fool the voters that things are all right. Big decisions are coming Nov 2. The FED will meet that day and of course we have the election. Do people believe that a Republican victory will moderate the Obama regime? If they do, they are mistaken. And the FED will do whatever it wants to do. QEII is coming soon.

Thursday, October 14, 2010

US Dollar at precipice.


Paper currencies, especially of the West, have been in a race to the bottom. With the ascencion of the Obama regime, the stage is set for the destruction of America's economy and the demise of the US Dollar.
The top graph shows the loss of value of selected paper currencies against gold. The loss has been steady for ten years. The currencies have lost a very substantial amoung of their value.
The second graph shows the the loss of value of the US Dollar against other currencies. The value of the dollar is plotted against an index, derived from comparison to other currencies. The general rule is that if a financial instrument buts up or down against a line ( be it either resistance on the way up, or support on the way down), it will go through that line on the third try. For the US Dollar, the magic number is 77.
The fall in the US Dollar is not accidental and not even due to economics. It is the deliberate policy of the Federal Reserve and the Obama regime. The use of the 'mark to market' accounting is aimed at bankrupting our financial institution. This reduces the value of America. A second way of doing this is to reduce the value of the US Dollar through inflation.
Beginning this week, BS Bernanke of the FED declared that the FED wants more inflation and will add to the outstanding currency. This has dropped the value of the dollar and increased the value of gold almost immediately (see next two graphs).
The last graph shows the technical expectation re the US Dollar. The head and shoulder pattern predicts the US Dollar to fall to 72 (in other words break through the 77 level) shortly. Indeed, the current value is at 76.5.
Analysts now predict the value of gold to rise now to 1,500/oz and both that and the value of the dollar are temporary figures. As nation after nation dumps their dollar reserves, the US Dollar will fall and there is no support in sight. Gold prices, on the other hand, are forecast to rise. Today, gold has reached $1,382/oz gold, but gold and silver mining stocks have not confirmed this rise.
The markets are waiting for yet another speech from Helicopter Ben.


Thursday, October 7, 2010

Gold correction accomplished.

Gold prices had been showing reduced volatility. Most of the time, gold prices have been increasing. However, gold had become overbought, which was shown by the gold price having been above the upper boundary in the graph for several days. I thought that a correction was coming (see last post). That correction occured as gold price fell today from 1,363 to 1,333. That was enough to bring the gold price back within the upper boundary of the expected range.

What happens now? Under normal circumstances, we would expect gold to come back to the 50 mark on the graph or even below. These downward jags represent the hesitation by buyers to re-enter the market as they wait for prices to come down some. Hower, the report from the gold market is that traders wait less and less, so gold prices might resume their upward march tomorrow. Regardless, whether gold starts its move tomorrow or Monday or Tuesday, the next high plateau is calculated to occur between 1,395 and 1,405.

Technically, there is no resistance to gold prices moving higher. A lot will depend on what the FED announces. The FED promised more QE if the economy softened. Well, it did, but the figures on unemployment are being fudged, so the FED may wait till after the election. Chances are though that the FED will print and gold keep rising.

Monday, October 4, 2010

Slight corrections under way.

We can see in the previous post that gold prices became overbought while the dollar became oversold. These conditions are shown by shaded areas. This will become corrected and price movements resume.

While, I believe that the FED is already doing quantitative easing, it is not doing so officially. The story making the news circuit that if employment and manufacturing numbers will be worse than expected, QE2 will be officially implemented at the November meeting of the FED.

What does this talk mean? Inasmuch as these numbers can be adjusted up or down, the FED has already decided on QE2 and its implementation is just a matter of timing and trotting out the proper excuses.

Another story floating around is that other countries (Japan for example) are already adjusting the value of their currency to blunt the drop in their exports by the drop in the dollar. Another story is that emerging economies (Brazil, India and China) are not that confident of their economic growth, so they are watching their currencies that these do not appreciate. This is a phony story though. China, India and Brazil are experiencing strong growth and do not need to debase their currencies to maintain their export advantage. All these stories are floated by the friends of the Obama regime to make QE2 palatable to the tune of a Trillion dollars.

Sunday, October 3, 2010

And now IT begins.


What exactly is "IT?" It is STAGFLATION, first experienced during Jimmy Carter's Presidency. I have already posted on the Raging Bull, how these concepts relate: first comes DEFLATION as shadowy regulators changed the accounting system to 'mark to market,' declaring many financial instruments worth zero and thus bankrupting banks and financial institutions. That was done to stop money circulation (Sept 15, 2008) and elect Barak Hussein Obama as President. The deflationary phase was continued to nationalize GM and Chrysler, the mortgage industry, student loans, and a good chunk of the banks. The nationalization of medical care was done via legislation. Bankrupting of insurance companies is in the works, forcing everyone into government-run medical care. The bankrupting of the power companies and a lot of industry awaits the passage of "Cap and Trade," which will put a large tax on using carbon-based fuels and transfer the capital to third world nations. The Obama regime and its Democrat base intends to put people on unemployment, our current version of the CCC camps of the 1930s.
To accomplish this, the regime had to "print" money which caused monetary inflation. I have described how this printing works - it is called "quantitative easing.'
Monetary inflation means that more money is around with no increase in what it can buy. Thus, the value of the money (dollar) decreases. Along with the drop in the value of the dollar, the price of gold and silver increase, as do the price of commodities (beans, wheat, meat, etc) and other metals besides gold and silver. And of course, oil.
Monetary inflation turns into price inflation as the price of commodities increase, even if deflation continues.
I will now review the evidence.
The economy has slowed as the regime's stimulus becomes less effective and as the regime's policies discourage investment in the economy. The regime's apologists trumpeted a "Summer of recovery," but instead of that, we saw the beginning of STAGNATION. Growth was forecast as 3.5%, but it was revised to 1.5%. Then it was revised to 1.6% and celebrated as much better than expected. STAGNATION IS HERE.
The first graph shows the price of gold. The rise in gold prices is obvious. Gold reached a new record price of $1,320/oz last Friday. The rise in silver was even more dramatic and it closed at $22.10 on the CRIMEX. (No graphic needed to dramatize the change from $18 to $22/oz silver).
The next two graphics show the drop in the value of the US Dollar. You can see the closing of the Dollar below its previous low. The third graphic down shows the breakdown of the head and shoulder formation in the value of the dollar and predicts the Dollar to fall below 72 on the dollar index. The current value of the dollar is 78 on the index.
The fourth graphic is the price of crude, oil that is. You can see an upward bias in higher highs and higher lows. The fifth graphic shows a similar pattern and clearly indicates that oil has broken out of its recent pattern on the upside. Note also that smart money is buying up oil contracts. Oil price is forecast to hit $95 by Christmas. The regime wants higher prices.
Finally, what about the Stock Market? Accompanying the yet secret quantitative easing by the FED, the Stock Market is also breaking out. The next to last graphic shows the formation of a new "golden cross," the crossing of the 200 Day Moving Average by the 50 Day Moving Average. The last graphic shows the breakout of the Industrials from a reverse head and shoulder formation. This forecasts higher stock prices.
Summary. The Markets are now in sinc. The slowing of the economy enters us into STAGNATION. Monetary INFLATION is shown in the continued rally in gold, silver, metal and commodity prices. Price inflation is still down the road, but it has begun. Everything is being recalibrate in the terms of a cheaper US dollar, even stock prices (which are rising as the value of the dollar drops).
Putting this another way, stock prices are decoupling from the economy and are now driven by the falling value of the US Dollar. PRICE INFLATION will now increase. Finally, the stage is set for another round of increases in metal prices lead by silver and gold. The panic phase in gold prices should occur in 2012, but we should have substantially higher gold prices in 2011. In the panic phase, gold miner stocks should decouple from the gold price and go into the stratosphere.


Friday, October 1, 2010

Markets in sink.

We see the Markets moving in response to a yet secret Quantitative Easing. Gold is rising, silver is moving even faster and oil has reached $80/bbl. At the same time, the dollar is dropping at a rather fast rate. All the Markets are now in sinc.

Irish eyes are NOT smiling.

The unraveling of paper currencies continues. Ireland's spread between its bonds and German bonds hit an all time high, which means that Ireland has to pay a lot of premium to roll over its loans. But, the Irish do not have the capital and will have to be bailed out. Cost? A reported $25B. Doable? Perhaps. But, the Markets are already lining up Spain for a hair cut. Spain's debt has been downgraded and its inability to pay will become clear shortly. Of the EU members, none is keeping within the required 3% annual deficit. Which means, more money printing. Will the German banks absorb the cost? Unknown at present.

Gold has moved to $80/bbl. We have seen this pattern a number of times - oil moving up to 80 then backing off. However, oil is now rising in context of a falling dollar and so the oil price may stay above $80/bbl as we go forward.

Wednesday, September 22, 2010


I can not say this enough times, nor emphasize enough, that the Obama regime is Jimmy Carter in spades. This is not a reference to Obama's ethnicity, but a reference to the fact that the Obama regime is committing all the economic sins of Jimmy Carter, but in larger proportions - in spades.
The economic changes we see are part of what bedeviled Jimmy Carter: STAGFLATION. This has several elements: 1. an economic stagnation, 2. currency inflation, to be followed by price inflation and 3. a sharp rise is commodity prices, especially gold. High interest rates come later.
The first two graphs show the Baltic Dry Index on two different scales. The Baltic Dry Index reflects shipping prices, which in turn is a measure of international shipping, i.e. the international economy. The three large peaks in 2009 and 2010 reflect fluctuations, but in 2010, the BDI dropped reflecting the current slowdown. Oil prices moved to the 72-84 range, while commodities have increased.
2010 saw a huge deterioration in the US economy. Housing sales have dropped to the lowest level of score keeping, along with housing starts. Unemployment is still hovering near 10% and the breathless shilling of the networks about the "summer of recovery" and the "good news" in initial unemployment (4000 less than expected but still near 500,000 per month) should result in the revoking of broadcast licenses of the alphabet networks.
So much for the stagnation part.
Monetary inflation meanwhile is picking up steam. The dollar has been steadily falling in value and currently stands at 80.44, with its 50 DMA is about to break below its 200 DMA - signifying and end to a recent rally. Gold has been moving up and is currently trading at 1,291$/oz, heading to the forecast of $1,300/oz.

Price inflation is just beginning to pick up speed. Insurance costs are skyrocketing, reflecting the changes mandated by ObamaCare. There are two things holding back price inflation: oil prices have been lagging and deflation continues to force companies to keep price increases to a minimum. This is about to change.
The Stock Market rally is coming to an end. The bearish sentiment (very low now, but the graph uses the bearish sentiment inverted) is hitting record lows now, which reflects a coming drop. The low bearish sentiment reflects the recent advances in stock prices. THIS IS DECEPTIVE. Recent increases in the DOW reflect the rise in APPLE nation, but generally, the number of stocks rising continues to shrink, as investors concentrate on the fewer and fewer companies that are still doing well.
A drop in stock prices is coming. How big a drop? Folks using the Elliot Wave Theory forecast the DOW to drop to 4,000, while Uncommon Wisdom (using the cycle theory) forecasts a low of 9,000, maybe 8,700 in the DOW. Much of the driving force for the Stock Market as well as the Gold Market will come from the size of the FED's quantitative easing. Bernanke is worried that the various stimuli have not stimulated the economy, while the continuing deflation keeps inflation too low. It is precisely these sentiments that will cause inflation to become higher than desired by the FED. And with that will come higher interest rates and a demise of the dollar.
The last graphic shows the expected prices for commodities and the dollar. I think the effects will be more severe. During Jimmy Carter's watch the inflationary impulse was tame compared to what's coming. There was no threat of European currency failure and bond defaults. In today's dollars, gold should reach $2,400/oz, but the financial panic may drive it twice as high. We shall see.

Sunday, August 15, 2010

Turning points.

Much is being made of the "Hindenburg Omen," a stock statistic that has always registered a certain level before a Stock Market crash. It has done so again. What is to be expected?

It is not the only 'omen' though. There are also movements in the economy (deterioration), Fed policy (real quantitative easing coming) and the gold market (upside move expected after Labor Day.

Most everyone has seen the deteriorating economic numbers. And you may have heard about QE 2 (Quantitative Easing #2). That was a phony. In a real quantitative easing, the FED credits itself with money it creates ex nihilo (out of nothing) then buys up Treasuries. In the so-called QE 2, the FED decided to invest maturing real estate bonds in Treasuries, not to increase the money supply, but to stop it from shrinking.

The Stock Market is about to undergo a drop and that will force the FED to do some real QE. They do not want the Stock Market to go to pot this close to the election.

A real QE will propel gold prices up and the dollar down. Gold is undergoing a reverse head and shoulder and gold prices are working on the right (up) arm. Technicals indicate a move to about 1,300-1,400/oz price range. Interestingly, the DOW is also doing a reverse head and shoulder. All this points to the start of accelerating inflation.

Tuesday, August 3, 2010

Is the correction in gold price over?

Gold price peaked in June then began to correct. The tops of the trading channel was connected with a green line. Following the double top formation in June, gold corrected about 110 dollars. The last few days, gold broke out on the upside of the trading channel and is trading at $1188/oz
as I am writing this post. The dollar is sharply down, while oil is past $81/barrel. All of this is confirmatory to a new increase in gold prices.

Thursday, July 22, 2010

Friday, July 16, 2010

GURUS: what about the $ and Au?

The guru I follow predicted gold to move between 1182 and 1215 for about a week and then go up again. No sooner did I read this prediction then the dollar dropped to 1182. How about the dollar? The prediction there is a further drop, then a recovery then a serious drop.

The Euro has stopped dropping as sovereign debts have been papered over temporarily. The US, however, continues on the destructive path initiated by the FED and Obama and deficits are growing at a very rapid rate. China's rating agency has already downgraded the creditworthiness of the US. Strangely, China is still propping up the Obama regime by further purchases of Treasuries.

The Stock Market continues to be volatile and gives every indication of a drop coming. Guru #1 predicts a restart of the Bull Market, because all equities will be repriced in the cheaper dollar.

Friday, July 9, 2010

Economic and market update.

Ronald Reagan used to say that the economy of the US was like a huge ocean liner; it would take a considerable time to turn it around. And so it is now, when the Obama regime is putting its prescriptions into effect. So, here are the economic factors and their consequences as they appear today:

1. Fiat currency creation.
Businesses are scrambling to move every penny of income into this year, before taxes go up. Even so, tax revenue continues low. The last two months saw the highest monthly deficits in history. How is this being financed? By Quantitative Easing? Such a nice name for printing money. Or, are there more Treasury bills being sold to gullible buyers?

2. Treasury yields are dropping and gold itself dropped. Ominous signs of stagnation.
If there were a real recovery, Treasury yields would be rising as the FED acts to stop inflation from getting hold. What we see are signs of stagnation as the regime continues to promote deflation. The deflation keeps price inflation down.

3. Gold prices and the dollar.
Gold prices were predicted to fall in the short term (not my prediction) and maybe rebound at 1182. Support levels at higher level were breached. The dollar is rallying once again as gold dropped. Gold prices traditionally drop some in the Summer and the next serious rally may not show till September. Deflation rules for now until Quantitative Easing pushes inflation. The prediction of 1350 for gold is still in place.

4. The Stock Market is rallying once again. A move to 12,000 may occur as fiat currency will flood the system.

Basic investment rec's have not changed.

Thursday, June 24, 2010

Turning points ahead.

Deutschbank puts out an indicator, that is the sum of a number of financial indicators, including VIX. The indicator has fallen to levels seen around the fall of Lehman Brothers. The indicator has a positive .98 correlation with what happens, so it is practically infallible.

What does this mean? It means that America's financial system is still in the dumps and that conditions are getting worse once again. Obama's prescriptions made the patient sicker. No surprise here. Just as Roosevelt's prescriptions did not fix the economy, neither did Obamanomics work. It is not supposed to work. A Community Organizer likes misery and wants more of it so there is a communist revolution.

The Stock Market is shaky and is ready to drop close to 9000. Gold is getting ready to march higher, but the dollar is not ready to topple yet. Maybe in the Fall.

Saturday, June 19, 2010

Where is gold going?


I begin this blog post with the graphic I used in the last post. It is the gold price as seen on June 14, which showed a wedge formation pointing sharply up. In fact, highs in gold prices had become steady, while lows were getting higher. This meant a breakout from that pattern by early July.
The next graph shows the actual breakout on June 18. Gold set a new high in US dollars and then sold off a few dollars.
There are four questions that are of interest: 1. what is driving the gold price? 2. how high will it go this year? 3. what happens to gold miners as gold prices rise? and what is the estimated high in gold?
The immediate answer to the first question is shown in graphic three from the top. Physical gold purchase (non-ETF) as well as by Exchange Traded Funds have risen sharply through 2009 and are continuing to rise this year as well. Last year, the total world production of gold was 2,524 metric tons and 3,386 metric tons were sold to known purchasers. Part of China's purchases are not recorded. Recent purchases by Exchange Traded Funds (ETFs) are continuing to rise: Swiss Gold Shares ($500M) are rising fastest; Central Gold Trust of Canada purchased 6,485 ozes, Scott Physical Gold Trust purchased 230,000 ozes SPDR Gold Trust (GLD) intends to purchase 22.7 million ozes. While purchases are increasing, world production of gold is dropping.
Another reason for the rise in gold price is the financial turmoil in Europe and the US. The Obama regime is intent on destroying Capitalism by destroying the banks and the US economy.
How high will gold go this year? Experts I consult forecast a high of $1,350, a modest sum considering the ultimate high in this bull market, which is pegged in excess of $5,000/oz at the end of the mania stage.
The next graph compares GLD (green), HUI (the gold miner basket stocks, blue) and the S&P 500 (red). We note that during May, gold miners took it on the chin while recently, they followed the S&P 500. Sometime in the future, gold mining stocks will take off and increase in price faster than GLD. When? Not known now.
Finally, a number of the world's powers are trying to produce a reserve currency to replace the dollar. I show the coin produced by Russia and the nick is my doing introduced by a mistake in copying. The Obama regime is printing money by the trillions and keeps inflation down by collapsing the economy via deflation. This may become the reason that ultimately pushes the dollar into a free fall and sets gold on a course that will push it to $6,000/oz. Jimmy Carter days are back.


Monday, June 14, 2010

Gold to break out soon.

Gold shows a trading pattern that we have seen a couple of times: a series of rising lows. The signal is for gold to break out to new highs between now and the first week of July. The breakout can occur at any time and is likely come soon. The dollar has stopped rising and is falling today, its bear market rally may be over.

Europe's eyes will now be riveted on the world cup and the coming financial crisis in Spain. Will Spain be able to roll over its debts? Will Italy, an aging team, be able to hold off Holland for one more tme?

The coming rise in gold prices signals a further series of troubles in European finances. This time, the dollar may not rise as much as when the Greek crisis broke, but gold should do a big bump.

Saturday, June 5, 2010

Economic failure dogs Obama.

Barak Obama had promised to lower the sea levels, end partisanship and institute racial harmony. The suckers listening to him ate up the balony. The reality is something else. The sea levels are irrelevant for the Pacific Islands that are growing in size. Partizanship is ever greater as people sense that the Obama crowd is bent on destroying Capitalism.

What is emerging is an economic failure coupled with incompetence. The stimulus failed to promote private industry. As many of us chronicled, it was designed to prop up and create government jobs. Private industry is failing and American icons such as GM, Chrysler and banks have already failed. Other industries like GE, US Steel and Alcoa may soon be taken over by Obama.

The drop in jobs created and the Stock Market signal troubles ahead. The graph I included show that during a bull or bear market, the S&P500 moving averages move in a parallell fashion, but during transition times, the averages diverge. The current divergence signals a coming drop in stocks as economic stagnation continues. Inflation has barely started and is masked by deflation caused by the collapse of the industrial sector. As government revenues fall, money printing will pick up and so will inflation. By now you should be out of stocks.

Friday, May 28, 2010

Is the US dollar doing a double top?


Most of the Analysts I read consider the US dollar in a bear market. However, the dollar moved from 74 to 86 from December to now and then is making a small formation that looks like a small double top. The double top is a sign of a loss of strength of the underlying issue being traded and the formation is confirmed when/if the second peak breaks below the trough between the two peaks. In this case, it would be a break below 85. Double tops are notoriously unreliable for prediction.
Longer term, the dollar may be setting up for an even bigger double top (see the second graph), where the confirmation point is 74.


Contradictions.


Brokerage houses tend to be optimistic. That is perhaps what fueled a letter I got telling me to expect a rally in stocks. Buy, buy, buy is the conclusion. The first graph shows the tea leaves the technicians read. The Market is clearly oversold, so we had a 200 piont rally in the DOW.
The second graph shows what the economists see. While, M3 is no longer published by the government, it can be calculated and M3 is falling at a rate not seen since the Depression. Today's discussion on Seeking Alpha (The Consequences of M3), tells us that government is driving us into economic depression. How is it done? While, the FED pursues a loose money policy on the surface, underneath, a small Agency requires the banks to put up 15% capital as reserve for every loan they make. That, of course, precludes the bank from making any money. So, while the FED pretends to follow a loose moinetary policy, the OCC counters it and is driving the banks into either supporting the regime in buying treasuries or fail.
The consequence is stagflation and eventual collapse if the regime is not removed. The last graph shows the gold price during the 70s and during this decade. It is earily similar. The graph predicts an explosive rise in gold prices to as much as $6,000/oz of gold.


Sunday, May 23, 2010

What now?

What a difference two weeks make. My last two posts on the economy, gold and the Stock Market touched on the topics of the increasingly grim looking European debt, predicting a breakout of gold past 1162 and topping out of the Stock Market.

So, what happened? Gold broke out and set new highs, the debt crisis identified and the Stock Market is teetering again.

What else has happened? While, gold set new records (1284), gold mining stocks lagged the increase in gold price. That suggested a drop back in gold price was coming and sure enough: gold dropped back to 1175 and finished the week at 1176. That sets up a powerful buying opportunity.

What about the economy and the Stock Market? The economy continues to sputter, but IMO it is early to expect a crash. It is like there is an evil spirit that continues to give the Obama regime advice to do the wrong thing. To be sure, the regime welcomes the crises it creates, these crises are excuses to grow the government and destroy Capitalism. Also, economic stagnation is hoped to deter inflation.

The Obama regime sounds like the Greek officials in the early stages of their boondoggle, when they trumpeted that they could borrow all they wanted to borrow at 3% interest. At some point though, that changed and changed all of a sudden. As the Obama regime prints money and kites checks to pay for the deficit and the takeover of business, it is setting the stage for the destruction of the dollar. All these trends will keep sending gold higher. At present, the failure of the Euro drives Europeans into dollars, but the FED opening the dollar window for European banks in fact ties the dollar to the Euro.

Investors are nervous and are selling equity. Interestingly, gold mining stocks have stopped falling, perhaps anticipating a new rally in gold.

How far will the DOW fall this round? Will it settle for a 10% correction to 10,000 or continue toward a 31% correction, back to 8,000? Will it touch 12,000 before it sinks back and leaving the smaller stocks to flounder? We might get an inkling next week.

Friday, May 7, 2010

Why European debt crisis is so deep.

I saw this graph on Seeking Alpha (posted by a Mr Davis) and I understood. European banks have been essentially kiting checks on a big time basis. The debts are hidden, because they are shuffled between the various countries and their banks. This is how check kiting works: A person owes his credit card company $500, but he does not have the money. However, he has four bank accounts. So, he writes the credit card company a check for $500 on bank #1. A few days later he writes a $500 check for bank #1 on bank #2 and so on. This is an unlawful practice, but is essentially what the European Socialist countries have been doing. It works with loans, too. These countries have been borrowing money from each other, but investors have found out and have raised the interest rate the dead beats have to pay. The problem is that the bills can no longer be paid, hence the crisis.

The Plunge


No, I am neither prescient nor do I have a pipeline into the trading centers that have a great deal of influence on stock trading. That said, it appeared to me yesterday morning that the Stock Market was nearing its top and a downward slide was quite likely. This prediction was born out within a few hours.
Today, I would like to discourse not on what was done but how.
If you listen to the pundits on TV, you come away with the impression that what made the Market go down was the fear created by the financial crisis in Europe and some trading errors. Of course, the financial crisis in Europe has been known for a while, though TV pundits tried their best to ignore the IMPORTANCE of it.
What happened was this: The Market was shaky, the DJI rise had become almost flat. It became vulnerable for a retreat. In came the trading houses and put in an avalanche of sales orders. Sophisticated traders have stop losses of 10-15%, so if a stock drops the 10 or 15%, it is automatically sold. This causes an imbalance (too many sellers, very few buyers) and the price of the stock begins to plunge. If you have a stock that is selling for $44/share and you have a stop loss at $36, it means that as soon as the stock goes below $36/share, a sell order will go in. Hyeah, but when will it be executed? The sell order goes into a cue and may sit there, while the price of the stock plunges to $32/share or even below. That is what happened yesterday. Many stocks plunged 50-60% and market makers cleaned them up at a bargain. Was there manipulation? You bet! Eight stocks went to 1 penny or zero for no reason at all, except for the manipulation.
Was early yesterday the top of the Market? We won't know that until the Market rallies again and then goes down. Right now, I would think that the Market will come back, but gold continue to rally after it, too, takes a breather.
I reproduced the DOW and its 300 DMA (top graph) and 200 DMA (lower graph. The top graph shows that the 300 DMA did not penetrate the 50 DMA. The 200 DMA, however, did penetrate the 50 DMA. Therefore, this plunge was more like a stiff correction then the topping out. As the financial crisis deepens in Europe, the Market will shake and gold will go higher.

Thursday, May 6, 2010

Has it begun?


Good weathermen are said to perform one more check before forecasting local weather: a quick look outside the window. No point forecasting fair weather if it is raining, knowledge of weather pattern notwithstanding. So it goes with forecasting financial developments.
So, I collected the most-watched financial numbers: the DJI (first graph), the US Dollar (second graph), gold (third graph), GG (the second largest gold miner in the world, fourth graph) and finally, 20 year treasury (last graph). Some of the numbers are quite surprising.
The DOW is nearing a top and no question about it. Stocks of small companies have been savaged now for a month or two and the rise in the DOW is almost flat. The current drop in stock prices is either a final correction before the top or signifies that we have passed the top.
What is astonishing is the continued rise in the value of the dollar, even in the face of rising gold prices. The fall in the value of GG is expected if we are at or near the top of the Stock Market Cycle, but the rapid rise in the value of Treasury Bills defies economic laws. Or does it?
For a while, the Obama regime has dampened inflation by causing a widespread destruction of financial institutions via the use of the 'mark to market' accounting system. The usefulness of this method ran out as the price of gold and oil began to rise. The regime can not raise interest rates without crashing the economy, so it does the only other alternative it has left: buying Treasury Bills. This is called "monetizing" the debt. Essentially, the Treasury can pay itself what it wants to "buy" Treasury Bills. This would explain the quite irrational rise in the price of Treasury Bills, which in turn takes up the value of the US dollar. The purpose of this illusion is to delay inflation and another economic slump till after the election.
The unraveling of Eurosocialism is under way. Well, at least their currency is unraveling. So far, the Greek left is unwilling to accept the conditions to rescue Greece financially and the revaluing of sovereign debt is still under way in Europe. In the US, States are broke and the country's economic troubles continue.
Will stocks now destruct? The volatility indicates that some kind of correction is under way. Whether gold stocks will give up their gain while gold prices rise IS the question. I am going to hold on to mine.