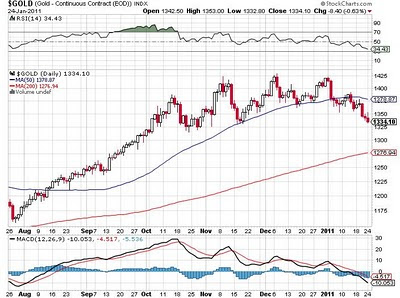


Speaking of the Gold Market, we have to answer three questions: 1. what is happening; 2. how long will it go on and 3. when will gold take off again?
The first graph shows the march of gold from 900 to 1450. We are in a gold bull market. The second graph down shows the last segment of the bull market up to before the correction. A strong (double) support level was set up at 1,225, then a weaker support level was established at 1,375. The third graph shows the breakdown of the upleg and the correction up till now.
A few points need to be pointed out: the march of gold upward has been steady; 2. the 200DMA shows no deviation in the rate of increase in gold prices; 3. the corrections along the way retrace 1/3 to 2/3 of the last segment of the bull, just as we would expect from the Fibonacci numbers
The one third retracement of the current segment (from 1150 to 1450) would put gold at 1350, while a two third replacement would put it at 1,250. The current price is 1319. We are clearly below the 1/3 retrenching, but still above the 2/3 retracement (end point at 1250). And the support level is 1,225.
The next graph down is GDX, the Gold Miner Stock Index. Gold mining stocks are related to the gold price, but move faster than gold itself. Note that GDX is already below its 200 DMA, as it usually is at the end of corrections. It could still move a little lower and not be unusual.
Individual gold miners move according to their own rhythm. THM (one of my favorites) has given up 1/3 of its gains in the last segment, while NAK (my favorite) is showing a takeover pattern and pays no attention to the correction.
This is why I did not sell into this correction. By the time you subtract commission twice, your scalping the drop is not that profitable. Plus, you may miss the bottom and get back in after the correction is over. So, it was not worth taking that risk.
Uncommon Wisdom, my favorite forecaster, predicts that the next up segment will be the steepest yet. Good investing.

No comments:
Post a Comment