Wednesday, December 21, 2011
ECB begins bailout of banks.
Just in on Drudge. The ECB extended 3-year loans to 589 banks in Europe. The loans total E523B. This insures immediate liquidity but is being described as totally inadaquate to backstop national debts or protect the European economies from a Depression. But, it is a beginning.
On the manipulation of PM markets.
London Trader describes the process in today's (Dec 21) post of King World News. Here is how it works: The bouillon banks of England coordinate their activity with the Central Banks of Europe. In the middle of the night, when trading activity is low, the bouillon banks flood the market with paper orders to sell in order to lower the price of gold. They do this three successive nights, each night taking out one support level. The central banks loan the bouillon banks gold to cover actual sales. Short term traders and even some funds are forced to sell. However, Asians are wise to this practice and have scarfed up 100 tons of gold in this latest "sell off." Silver prices are kept in line by selling silver borrowed from SLV. London Trader estimates that SLV is short 20M ounces that it lent to the midnight thieves.
Meanwhile, silver stocks are very low again, with the waiting period being 3 months on large order delivery. Meanwhile, you can buy shares in silver miners for a song and dance. When this game of manipulation breaks down, expect prices to rise very rapidly.
What about Larry's prediction of gold going to $1.200 an ounce on the demise of the Euro? IMO, forget it. Will the ECB allow Europe to slide into a depression, the Euro discarded and the EU busted up? I don't think so. The ECB and the FED will digitize trillions to prop up the banks. That inflation will follow? So? It will make the remaining gold worth more and the central banks will be brought back into the black.
Monday, December 19, 2011
So, where is the bottom?
 Once again we ask 'have we hit the bottom of the correction?' We, of course, reject the idea of the MSM that gold's bull market is over. None of the forces (fundamental causes) that propelled gold has improved. Some got worse.
The graph is from "Casey Research" and shows the sizes and dates of the corrections in the gold bull market. The current correction is 12.5%, about average.
Gold is hovering around 1,600 and full hundreds tend to act as support and resistance. The US Dollar is above 80.2 and shows some tendency to stabilize.
Pundits defer as to where we are. Larry is most bearish, forecasting gold to fall to 1,200. Others (myself included) simply do not know. Larry's forecast for the low is February next year. Tempus fugit.
Wednesday, December 14, 2011
Liquidity crunch hits the West.


 The REPO RATE (the discount rate of repurchasing govt security by the central bank) is a measure of the money supply. To temporarily increase the money supply the central bank reduces the repo rate. This was done in 2008 when a liquidity crunch hit the West and it is being done now. The cause of the liquidity crunch is the European financial crisis that drives people into dollars. Consequently, the Dollar Index has skyrocketed to 80.57 this morning, (abrogating its double top) and sent gold into a free fall, flirting with the 1,600 level. This then continues with the gold breakout on the downside.
Larry forecast the drop in gold and the increase in the Dollar Index. He forecast that the Index may hit 82 and that gold may fall past 1,500. According to Larry, gold will hit bottom in February, which is the forecast rate for the end of the Euro. The fall in the repo rate tells us that the FED is pumping out money to keep European banks afloat, but the ECB must digitize more Euros if that currency and the banks are to be rescued.
The rate of fall in gold also tells us that some country (perhaps Italy?) is selling gold big time, although it is the paper gold market that is being liquidated. These are interesting times.
Tuesday, December 6, 2011
Financial Stress Continues.

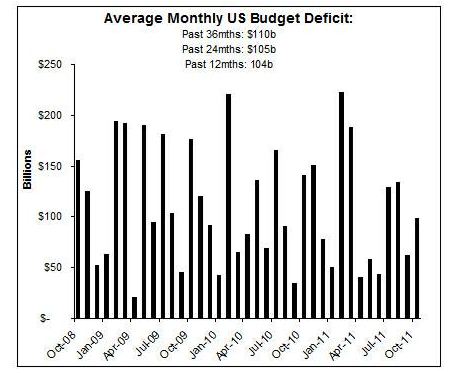

 Weiss Research claims that its ratings are more accurate that Fitch, Moody and the rest. And Western Countries do not fare well, as indicated by the top graph. The US continues to run a monthly deficit of about 40% (graph two). What is more critical is that we are about a month away from bumping up against the latest debt ceiling.
Debt-related events are still driving financial news. Weiss's list of problem banks indicates that US and European banks are nearly insolvent. Opening the Dollar Window to European banks had staved off insolvency for now, but Greeks have pretty much emptied their banks. That means that the Greek economy can not recover and must again be bailed out and soon.
The convergence of these two events(reaching the debt ceiling and threatened default in Europe) are expected to raise gold prices, as it did last time (lowest graph). Gold and silver prices are still consolidating, but we are beginning to see higher lows. For example, during this current slide in gold prices, gold fell to 1,700, instead of the 1,680 support level. PM miners have been in a consolidation phase for a year and their breakout is now suggested. Yamada's reading of the financial bones (technicals) suggests a continuation of the consolidation, while Larry predicts gold to hit a low in February. Trends are converging.
Friday, December 2, 2011
The Markets refuse to...

 follow the predictions of those pundits,who are predicting a drop in gold prices and a continued strengthening of the US Dollar. Take Larry. He continues to see a very serious weakness in gold and figure it will drop to $1500, maybe lower. The weekly gold prices tell a different story. Gold continues its upward climb. In fact, the MacD histograms give up a double peak below zero, which means that we are not yet to the half-way point of the current rally. Look at the Feb-July period of last year and we see a similar formation. We can expect then the rally to continue for an equal time, such as during Dec and January.
We see the opposite with the US Dollar. We see a double top formation, with the Macd being in the positive territory while the actual value of the Dollar Index is beginning to fall. Again, Larry's prediction of the Index going to 81 and above is not likely.
Finally, I have said in a previous post that the FED can act any time and it is not likely to wait untill the DOW goes to 9,000. The bailing out of the European banks creates something like $800B, so this may act as QE3. Indeed, the FED's action lifted the Markets and the DJI finished above 12,000 for the week. Europe's long term problems have not been fixed, but in the short term, they have the FED ready to bail them out.
Wednesday, November 30, 2011
International QE?
The following report came out this morning:
"The European Central Bank, U.S. Federal Reserve, the Bank of England and the central banks of Canada, Japan and Switzerland are taking joint action to make it cheaper for banks to get U.S. dollars if they need them."
"The European Central Bank, U.S. Federal Reserve, the Bank of England and the central banks of Canada, Japan and Switzerland are taking joint action to make it cheaper for banks to get U.S. dollars if they need them."
Tuesday, November 22, 2011
Soicialist "thinking" is one folly after another.
Socialists from Europe and the US are drowning in stupid thinking and are pulling down their countries. Do you recall EU officials who decided what curvature a banana could have? I am not kidding. Then there was the "Global Warming" scam, aided and abetted by scientists from East Anglia getting caught at producing fraudulent data. So, here comes the latest scam: in order to prevent bottling companies from selling bottled water, EU officials decided that bottled water does not rehydrate and can not be advertized as such. They relied on some other fraudulent junk science. Do you then wonder that the Socialists got their countries' finances so screwed up that they can not fund their borrowing. Greece is a basket case and so is Ireland and Portugal. These countries have already received bailouts. Italy and Spain are under the gun now and the new Spanish PM admits that Spain can not finance its debt at 7% rate. Same for Italy. And the contagion is now spreading to Belgium and even France.
Socialists are just as nutty in the US, except we call them Liberals. In a Florida school a girl kissed a boy and the school called the cops because they considered the event a "sex crime." Really? In another school, a Mother warned school officials that her boy's entanglement with a gay student was going to be trouble. The school's answer? Let the boy explore his sexuality. So, the boy shot the gay student.
Nothing shows the stupidity and duplicity of Liberals better than the just concluded meetings of the Deficit Reduction Committee. How Americans put up with the charade and why they allow the Media to misreport it is a mystery to me. The whole thing was a sham. The Committee supposedly was called to decide on how to reduce the deficit by $1.2T in ten years. That's $120B/year. Considering that "baseline budgeting" means at least a 10% increase in the budget each year, the s0-called "cuts" were no cuts at all, but a slight slowing in the increase in spending (the current base-line budgeting calls for an increase of almost $400B/year). So, why did Congress engage in this dishonest charade?
Republicans are deathly afraid of the power of the Media, so they agreed to the lifting of the Debt Limit. The deficit reduction panel was a fig leaf for John Boehner, who negotiated the "deal" with Obama behind closed doors. The Dems had no intention of reaching a deal. What they wanted was a campaign issue. They can now shriek (along with the Media) that Republicans are obstructionists that they want to preserve "tax cuts for the rich." Obama can up the ante by insisting on to repeat the cutting out of the payroll tax, making 47% of the taxpayers paying nothing. There is one more sham to this whole wretched deal: the "sequestering." A $600B cut in the military budget is included as another club that Dems plan to use to scuttle ANY "cut" even the phony cut.
What the Dems want is what goes on in Europe: 50% income tax for workers and even higher taxes for the high earners, emasculating the military and low growth of the economy. That way, Americans will be slaves to state control.
Monday, November 21, 2011
Political and financial interactions.
1. What is driving up the US Dollar?
The US Dollar Index follows a pattern like a choreographed ballet. During the night here (which is the trading day for Europe), the US Dollar Index increases and during the day here (after markets close in Europe), the Index falls. We had seen this ballet play at 76. then at 77. and now at 78. The Index rises in Europe and falls here, but the rises are larger then the falls. How far will it rise? Hard to tell. When the forces that propel the Dollar weaken, the rise will stop. So, what is driving the US Dollar?
a) Japanese desire to reduce the value of the Yen so they can increase export to the US.
b) This is duplicated by the Chinese. They, too, are interested in keeping up the value of the Dollar. While, the Japanese are telling us that they are buying Dollars, the Chinese are close mouthed. As the value of the Dollar rises, gold is going down. This, too plays into Chinese and Indian hands to facilitate their buying of gold.
c) As the sovereign debt crisis unfolds in Europe, Europeans are piling into US Dollars, which is still the reserve currency of the world.
2. The "deficit reduction Committee."
During the last Summer, the Democrats and the Media staged a phony theatrics when the country was reaching the debt limit of $14T. If the ceiling is not lifted, they shrieked, the Country will default. That, of course was a lie. But Boehner caved and agreed to raise the debt limit by 2.T, enough to get Obama through the election. To give Boehner a face-saving fig leaf to hide behind, the Dems agreed to a "Deficit Reduction Committee" (which is to negotiate how to cut $1.2T in 10 years). Failing to agree on a plan to cut, automatic cuts would ensue beginning in 2013.
When Reagan ran against Mondale, Mondale said he had a plan to reduce the deficit by raising taxes. Reagan replied "you don't have a plan to reduce deficit, you have a plan to increase taxes." The Democrats are replaying that scenario. Dems offer "cuts" that come from getting US troops out of Afghanistan and Iraq in exchange for raising taxes. Sure, it would start by increased taxes on the upper earners, but that is peanuts and more tax raises would be in store. If Republicans agreed, they would suffer the fate of the first Bush.
In fact, the Dems do not want an agreement. They want an issue to run on. A lot of people think that taxing the rich is a splendid idea, even though it would not fix the deficit problem. The Media will blame Republicans as expected. So, the Committee is drafting a statement that they failed. And they will fail unless Republicans will cave today or tomorrow (they already offered a $300B tax increase).
3. The sovereign debt crisis of Europe. It continues. There are no credible plans to pay off the debt, there are only plans to fool the investment public. Investors, meanwhile, have already served notice that they want higher returns on Italian, French and even German bonds and the time is clicking on the ability of these countries to roll over bonds that are expiring. A downgrade for French and Italian bonds is in the works and I do not believe that a change in government in Spain will stave off their downgrade. Further political repercussions are coming. Larry and many others believe that the EU will dissolve and the Euro will be abandoned.
4. Larry's latest forecast. It reiterates what he said previously: the DOW at 9,000, gold back to much lower levels, a temporary high for the US Dollar, etc. Larry believes that only QE3 will stop this process. I still maintain that the FED continues to ease and does not need to declare QE3. But we will see. So far, it goes according to Larry.
Sunday, November 13, 2011
Another agreement with Larry
Conclusion
Merkel and Sarkozy will soon learn that an orderly break-up of the Euro is not possible. Even the slightest hint that a breakup is being contemplated will cause a global financial disturbance that is so great that any perceived benefits of a break-up will be completely overwhelmed by the costs that will be imposed by the market.
By the same token, Merkel and the Germans are unwilling to do what it takes to save the Euro.
Thus, a situation is fast approaching where a crisis is becoming unavoidable. European leaders cannot break up the Euro without incurring unacceptable costs. At the same time, the costs of saving the euro seem prohibitive. The result of this configuration of choices will likely be paralysis that will lead to outcomes that will be dictated by panicked financial markets rather than carefully planned policies.
Markets will move must faster than the Eurocracy can agree on anything of substance. As detailed here, various markets that have served as leading indicators in the past appear to be getting ahead of the curve already.
In the absence of aggressive intervention by the ECB, I believe that Europe could find itself in the midst of a full-fledged crisis before New Year. This accelerated timing could be averted through a series of aggressive and shrewd actions by European leaders and the ECB. However, investors should prepare for this potential eventuality before New Year.
Under such circumstances I would expect the S&P 500 index (SPX) to ultimately fall to the area between 950 and 1,020 within a matter of just a few months. I expect the Nasdaq Composite (IXIC) to fall to the area around 1,850-2,000. The Dow Jones Industrial Average (DJI) should ultimately decline to an area between the 9,000 and 10,000 level.
This implies declines for the SPY, DIA and QQQ of between 20%-30% from current levels.
Given the magnitude of the risks faced on a six-month time horizon, in my view, it makes little sense for investors to purchase or hold even very attractive equities such as Apple (AAPL), Microsoft (MSFT) or Pepsi (PEP). Investors will probably be best served by raising cash and letting the current highly dangerous situation play itself out. I believe that investors that raise cash now and wait for the storm to pass will likely be highly rewarded for their patience and discipline.
James A Kosterhyz todat in seeking Alpha.
Friday, November 11, 2011
Europe unraveling.

Yes, I have written about the coming unraveling of the European Union, but now that it is almost upon us, we need to look at its history and mechanism. Many of the words that are involved have histories and concepts in them that are at the heart of the matter. Such as, bonds, bunds, basis points and point spreads.
Bund is a word that refers to several things: 1. a way by the water or just a road; 2. an organization or group of people (root is 'banda' a Sanskrit word) and 3. German government bonds. There were Jewish bunds (East European Socialist groups) and National Socialist bunds (such as Hitler's). World War One killed off the flower of French, German and English youth and left these countries with inflated currencies (the war was financed by printing currency). Rather than devaluing their currency in comparison to gold, these countries decided to withdraw currency, which created a Depression that lasted almost to World War Two. Europe became Socialist: Germany ruled by the Nationalist bunds and England by Fabian Socialists, while the US came under the spell of the Democrats of Roosevelt (an offshoot of Fabian Socialism). In the East, Russia came under the rule of a very virulent rule of Socialism known as Communism or Bolshevism. The Bolsheviks got their name from the Russian word "bolshe," meaning greater. The Bolsheviks came to claim majority status in the population, mush as the 99% er "OCCUPY" crowd does today. The Western brand of Socialism (beginning in England and spreading to the rest of Europe after WWII) left most of the Capitalist system in place, but established income distribution through high taxes and government programs of medical care, education and welfare. The Eastern brand of Socialism expropriated the means of production and established central planning by the Communist Party.
Communism cracked up first. People who were good at achieving political power were not good at running businesses. Fabian Socialism in Europe and in America lasted longer, because it allowed those with the talent to run business to to just that. European Socialism is cracking up, because Europeans are further along than we are. Europeans, for example, have government-run free medicine, free education and government-run retirement. All these things required financing. Since, Western Socialism is anti-growth ( higher earnings jack up your tax rate and that means you work for the government redistribution), the government programs were paid for by borrowing money via issuing government bonds.
There are two kinds of government bonds: plain govt bonds denominated in local currency and sovereign bond, denominated in some other currency. When the EU was formed, members of the EU had accepted the Euro as currency, so all their bonds became sovereign bonds. That is why we read about the "sovereign debt crisis." Still, we see the crisis moving from Greece to Ireland to Portugal and now to Italy. Why? Because these countries must roll over part of their debt and the new bonds reflect their credit worthiness. How? Italian bonds are compared to the German bonds called 'bunds' and the rate of interest the Market demands is higher for the Italian bond than the German bund. The difference is quoted in 'basis points'. One basis point is 0.01% interest rate. Thus, if the Italian bond pays 7.0% and the German bund pays 6.5%, then the difference is 500 basis points. The graph shows how the difference between Italian and German bonds has skyrocketed.
What's the problem? As the spreads widened for Greece, the European Central Bank and the IMF stepped in to essentially become the creditors of Greece, so they would not default. With Italy under the gun, the procedure of rescuing Italy will be impossible. Why? Because the Italian debt is too big to finance without printing up a bunch of Euros. Why is a default bad? Because a lot of Italian bonds are owed by European banks and if Italy goes under, the European banks go under. Why can't the European Central Bank (the ECB) print up enough Euros to buy up the Italian bonds, along with the Irish, Greek, Portuguese and Spanish bonds? They could, but Europeans still remember what happened to the currency of Weimar Republic and they are terrified of the prospect. Can the Chinese step in? Yes they can, but they demand trade concessions Europe can not live with. Besides, China does not have enough money.
Is there another way out? That is what the French and the Germans are looking for. So far, they are thinking about kicking out the dead beats and essentially ending the EU. Unfortunately, the Scandinavian countries and Belgium are soon to get under the same gun as Italy.
Could the US help? Yes, temporarily. With the election of Barak Hussein, the US is now running a deficit of $1.4T and growth has slowed as various Socialist schemes and impediments to growth plague the US economy. If another $3T is added the US will go into hyperinflation.
The only way out is to cut back on government programs, reduce taxes and encourage growth. By now, the electorates are so brainwashed with the concept of "free" government programs that they no longer can think of providing for themselves. Besides, the Media and Academia are run by the Socialists and they keep up the propaganda. Short of transporting these people to another planet little can be accomplished.
Ironically, the Chinese Commies understand and China is growing by leaps and bounds.
Wednesday, November 9, 2011
The Market that won't...


 Fresh from missing the Summer rally in gold, Larry predicts that gold will fall hundreds of dollars/oz, to recover only after a big drop in the DOW to 9000 and QE3. Since, his prediction is now almost a month old, it is appropriate to examine the data.
 The top graph shows the weekly gold prices. The graph shows a market that just won't quit. The MACD tells the story that we can now expect the blue columns to cross to the upside and keep going for several weeks before another high is reached, most likely above the previous high.
The second graph shows the DOW. The Industrials just broke out of a wedge on the upside. Granted the preliminary numbers for today show a 200 point drop in the DOW, the MACD shows a steady rise. So, there is no sign of an immediate drop.
Finally, the daily gold price. We see gold rising toward 1,800.
Today, we see counter moves everywhere. The Left prevailed in Ohio and unions were successful in repealing the new labor law, Mississippi turned down a constitutional amendment to protect babies from conception and Berlusconi is promising to resign. The debt avalanche has finally reached Italy and Italian bonds reached 7% - an interest rate the country can not sustain. The ECB intervened to reduce the rate, which raised the value of the US Dollar and restrained gold, if temporarily. Eventually, the ECB will have to print more money to help Italy roll over a total of 1.9T Euro debt.
I think Larry is wrong again. I believe that the FED is printing again and it is not waiting untill the Stock Market crashes. The DOW will stagnate untill we see the next phase of inflation that will cause dramatic rise in equity prices and PM prices.
Sunday, October 30, 2011
Gold and silver continue their rise.


It is time to review the situation re gold and silver. Are we in fact at the beginning of a steep rise (as experts on KWN predict), or are we at the beginning of a steep drop as Larry predicts? Fresh from missing the Summer rally in gold, Larry now predicts a sharp pullback in the DOW to 9,000 and a pullback in gold to maybe as low as 1,100. So, it is time to look at the charts again.
The top chart shows the weekly price of gold. In line with previous predictions of a faster rise, weekly gold rose at the steepest rate since 2008. The MACD hit a low and has entered into an up phase and it, too, predicts a fast rise ahead.
Along with gold, silver began to rise as well. Since, silver rises faster than gold, this shows up in the gold to silver ration falling again (second graph down). This is again an indication that both gold and silver are rising again.
The next graph is the actual silver price. Note that it has kissed the 50 DMA, so further confirmation on the upside is required.
The final graph is the weekly silver price. It, too, shows a breakout on the upside. One of my gurus has issued a BUY rec on silver.
The DOW has also skyrocketed, so Larry's prediction of DOW 9,000 does not look so good. You may say that the big day Thursday was on the false premise that the European crisis has been fixed, but classical use of charting data ignores economic data, it only treats technical data.
Coupled with the sudden drop in the US Dollar, we can confidently say that the financial world has entered a time of inflationary expectations. Precious metals have risen and oil also. The Dollar has dropped and the DOW stays elevated. The latest round of meetings in Europe confirmed a printing of at least 1T Euros and the rollover of Italy's bonds next year may require the printing of possibly as much as 2.5 T Euros. The Markets are again in sync.
Sunday, October 23, 2011
PM fails, at least for now.
In the Silver market, the paper trade and the actual trade of metal are grossly out of sink. You can buy paper silver, but getting actual silver for delivery - you have to wait. For end users, the silver they use is relatively minor, so a price squeeze is developing.
There was also an attempt last week to knock the gold price down. Some entity was walking the price down by offering gold for sale. There was a ton at 1,613 and some more below 1,590. The Chinese swooped in and scarfed up a ton at 1,613, upon which the price went back up to 1,643 and the orders below 1,600 disappeared.
The general rule of the Market is that the longer the price is held down by manipulation, the larger and sharper is the rise when the manipulation no longer works.
Saturday, October 15, 2011
Gold: coming out oif the correction.


 Gold is coming out of its correction. The actual gold prices are shown in the top graph. Note the volatility of prices, which is typical for a market changing directions. The second graph shows the break in the US Dollar. UUP tracks the US Dollar. The third and fourth graphs show weekly gold prices and end in the bottom of the correction.
The last graph shows the gold price plotted on a weekly basis. We now have two consecutive weekly rises, which is a confirmation of the end of the correction.
Three aspects of the graph are noteworthy: 1. The MACD lags the weekly gold price though it is bottoming out; 2. we are seeing the beginning of acceleration in the gold price, similar to what we saw at the end of 2009 and 3. we now expect a sustained rally in gold that will last into next year.
What about Larry's predictions of gold dropping back maybe as far as 1,100? Not going to happen. Gold is migrating to the East and is getting permanently sequestered there. Tremendous quantities of Euros will be printed to recapitalize European banks and the FED will continue injecting money into the pot. It is not in US interests to drive up the price of the Dollar, so we already see a drop in the Dollar. It is at a tipping point and if it goes below 76 a further downward drop can be expected.
Thursday, October 13, 2011
The coming Treasury Bubble.
I offer you this article that explains why "Operation Twist" is a failure. What the article does not say is the Operation TWist ensures the necessity of QE3, more inflation and a popping of the Treasury bubble.
Fed Unable to Prevent Rout In Long-Term Treasury Market
by: James A. Kostohryz October 12, 2011 , From Seeking Alpha.
Long-term Treasury yields have spiked above the levels that they were at before the Fed announced Operation Twist.
The Fed does not control long-term interest rates. It never has; never will. The Fed cannot even control yields on long-term Treasuries (^TNX, ^TYX), much less long-term borrowing rates to the private sector (LQD, JNK, HYG)
On September 22, 2011, one day after Operation Twist was announced, I warned investors: Nobody is bigger than the bond market; not even the Fed. Consider why:
Operation Twist is not big enough to matter. Operation Twist purports to buy up $40 billion or so of long-term US Treasuries (TLT, IEF) every month. That is relatively small change in a market of this size. The global market for fixed income is over $90 trillion USD. By my reckoning, yearly traded volume is well in excess of $300 quadrillion USD. On a monthly basis Operation Twist would represent about 0.4% of the total global bond market. And it would represent 0.00002% of global bond trading volume during that period.
Quality more important than quantity. Ultimately, long-term inflation expectations and long-term interest rates are a function of confidence in the currency (UUP). The quantity of bonds purchased by the central bank is an ambivalent force. On the one hand, under specific circumstances Fed purchases of long-term Treasury securities could exert downward pressure on the yields of these securities. However, under a different set of circumstances Fed purchases could have the opposite effect. For example, when the Fed purchases long-term Treasury bonds at negative interest rates (T-Notes at 2.0% and inflation currently at 3.8%) it is clearly “debasing” the currency for reasons spelled out in detail here. In this case, the debasement – the difference between the real (inflation-adjusted) NPV of the bond and the face value of the currency issued-- is of a magnitude of about 17%. This sort of operation has consistently served as an inflection point in the evolution of inflationary expectations in the history of inflation crises in various nations. Thus, Fed purchases of long-term Treasury securities in these particular circumstances could actually precipitate a bond market selloff and a spike in yields.
Fed risks “put back.” If investors begin to lose confidence in the US dollar they will begin to “put back” long-term Treasuries to the Fed en masse. There are currently over $15 trillion in US Treasuries with remaining maturities of over six years. Even if a small percentage of holders sell their bonds on the secondary market due to a loss of confidence, the Fed’s $40 billion per month program could become overwhelmed very quickly.
Market could force QE3 or rate cap. If the volume of sales of long-term US Treasuries were to become too intense (or demand for long-term Treasuries were to decline significantly) the Fed would be obligated to expand the asset purchase program in order to hold long-term rates down. This would require the creation of large quantities of money and a further dramatic expansion of the Fed’s balance sheet. This in turn would tend to fuel further skepticism towards the USD (UUP). History suggests that the situation could very quickly spiral out of control.
Conclusion
Ten and thirty year Treasury yields have pierced the levels that they were at prior to the Fed’s announcement of Operation Twist. This has occured despite the fact that there are no significant signs of economic acceleration and the fact that equities (^GSPC, ^DJIA, ^IXIC, ^NDX, SPY, DIA, QQQ) remain mired in a bear market.
Having said this, is still too early to say that Operation Twist has failed. However, there is no gainsaying the fact that less than one month after the policy was announced, a key benchmark of failure has been registered -- long-term rates are higher than they were prior to Operation Twist.
The potential loss of credibility on the part of the Fed that could arise as a result of a failure of Operation Twist could have momentous consequences.
Disclosure: I have no positions in any stocks mentioned, and no plans to initiate any positions within the next 72 hours.
Saturday, October 1, 2011
Tracking the gold price.


 This is the time to examine the behavior of the gold price. Larry's forecast calls for a fall in the DOW to 9,000 and the PMs to crash right along with it. Since, we saw a movement in the DOW to below 11,000 and the serious drop in the PMs, do we accept Larry's analysis or, is there an alternate explanation, i.e. an alternate forecast?
The first graph shows gold price plotted on a semi log scale along with the 30 DMA and the 200 DMA. The graph is very similar to the graph of GLD in the previous post. In fact, I chose the 30 DMA to show that the correction bottoms fall on the 30 DMA.
In the next graph, I used the 50 DMA and labeled the rallies. There were 7 of these. A couple of features are worth mentioning: 1. the 50 DMA and 200 DMA were converging up to rally #3 and then began to diverge, so that the 50 DMA began to run faster that the 200 DMA. This indicated a rising price in gold; 2. Another inflection point occurred in the last peak (rally #7), which indicates that gold prices will now accelerate. Note that peak #2 was short and peak #3 was almost 6 months in duration, therefore, we expect now a long period of rising gold prices. Note also that when the MACD rolls over to a negative number, it indicates the beginning of rising prices. That is, the MACD may remain negative even when gold prices already are rising.
Peak #7 (or rally #7) is of particular interest. First, it was larger than the other peaks and was followed by a .6 Fibonacci retracement. Also, the bottom of the replacement was intraday (about $100) and the downward move successfully tested the 50 DMA.
The first two graphs are semi log, showing gold price on a logarithmic scale. This tends to reduce changes toward the higher numbers, so I replotted gold prices on an ordinary numbers scale. This does not change the conclusions, but lets us see some trends more clearly. For example, the inflections during peak #3 (when the 50 DMA began to accelerate away from the 200 DMA) shows up better and so does the inflection point in peak #7. If this trading pattern holds, peak #8 should be even bigger than peak #7 and take gold prices past 2,000.
Could Larry be right that PMs will crash along with the stocks? Sure. As YB said 'it is hard to predict things, especially the future.' However, Larry had already missed the Summer rally and he said that if gold hits 2,100, he will go in. The next two weeks should be interesting.
Thursday, September 29, 2011
Gold correction nearing end?

 There are a number of questions re gold that we need to answer now. Perhaps, the most important one is: 1. is the correction over? I have used the graph of GLD as well as gold itself to try to answer this question.
GLD, when plotted on a weekly basis shows a very nice straight line vs its 30 week moving average. The value of GLD is pretty close to the moving avg, though the moving avg shows an upward displacement. The MACD tells us a slightly different story. Following a drop, the MACD takes 2-3 weeks to turn positive again. Next week may be the low point of the MACD.
Interestingly, the 30 day moving average of gold shows almost the exact pattern.
We may then conclude that the gold price is near the bottom in this correction, though a slight drop may yet occur.
There is another question that we might ask, though we as yet can not answer. Is gold price entering a steeper rise? Or put it another way, will we follow up the last peak with another peak that will occur at the same elevated rate as the last peak? If so, the next peak in gold may take it to 2,200 to 2,500. If that happens then the gold mania will occur in 2012.
Tuesday, September 27, 2011
So who was right?


So far, I must say that it was Larry that carried the day. He forecast a big drop in gold and silver and predicted that the DOW would fall to 9,000. In fact, gold took a steep dive to 1550 or so before recovering some and closing above 1,600. Today gold is up again, but eroding some.
The DOW is also moving up and it had a good day yesterday. Will we disregard the clear head and shoulders? No. Volatility is still the name of the game.
Tuesday, September 20, 2011
And from elsewhere: a different story.

 "When some weathermen predict rain and others predict sunshine, it behooves the prudent man to keep an eye on the sky and on the radar, if available." Geezer Bela in Exile
Larry is a superb technician and he does rely on formulas that DO work, so his predictions should not be dismissed out of hand. Still, there are those other experts on KWN and they are not chopped liver, either. Louise Yamada likes the bull market for gold and silver, though she does not like the miners. Rob Arnott warns of tremendous inflation coming. And Robin Griffith says: "only a fool would short gold here." Larry recommends using a double short fund to protect current holdings.
IMHO, the divergence of opinion reflects the volatility in the Markets, which is another way of saying that there is a lot of uncertainty. As I write this, the price of silver is at 40 and gold is at 1,800. Both were a bit lower earlier. Gold has a support at 1,780 and silver at 39. So much for the radar.
Now for the look at the charts.
Silver is still increasing so its 50 DMA increases faster than the 200 DMA. Gold, on the other hand, is still increasing so that its 50 DMA parallels its 200 DMA and both are rising consistently.
Could Larry be correct that if/when the Stock Market retreats, people will dump their gold and silver for cash, as they did in 2008? Not likely, say experts on KWN. We face a different situation now. In 2008, the money circulation was virtually stopped when the FED imposed "mark to market" and people needed cash. Now, people are liquid.
Larry's formulas predicted that when the Stock Market will tank, gold and silver (and the miners) will not. He now conveniently ignores this earlier prediction. Something else that Larry ignores. The Greek "crises" is ON/OFF as their cash allotment is held up. There is no reason for Greece to default. Neither is there certainty that the US will have a double dip recession. Central banks can postpone these events by printing more money. True, that will not solve the long-term problem (governments spend too much and capital formation is inhibited by high taxes), but government can BELIEVE that more printing of money will do the trick. And that means that precious metals will keep rising in terms of currency. So, the argument is what happens if there is a sell off on Wall Street.
Monday, September 19, 2011
Larry: the sky is falling!
Larry's formulas are at it again. They predict:
1. the failure of the Euro;
2. the breakup of the EU;
3. double dip recession;
4. a drop of the DOW to 9,000;
5. a slaughter of the commodities including silver and gold.
Curiously, Larry tells us that the FED can do moreless anything it wants: 1. reduce bank reserve requirements; 2. force the banks to lend; 3. buy stocks and bonds and, of course, print more Dollars. What the FED can not do is print more money and reduce the amount in circulation at the same time. Not unless it sequesters the new money in the banks by paying the banks interest (as it is doing now).
Larry's thesis is that we are heading into the same type of environment as 2008, when everyone was liquidating assets to get cash. In such an environment even gold is sold off. However, in 2008 the FED was working on creating an economic stoppage to elect Obama. Recreating 2008 will not get him re-elected.
Do you hear the foot steps?


 Can you hear the foot steps? It is the chickens coming home to roost in Europe. Secretary of the Treasury Geithner flew to a meeting in Wroclaw, Poland and told the European finance ministers to do what the US does: have the Central Bank hand a check to member banks and tell them to tack on a zero - Geithner calls that "leverage." It is counterfeiting on a grand scale.
 But, Europe is not the US! The EU has several countries (17) and they all need to be consulted. And they all have different level of interests, different ways of looking at things.
This is the week when the chickens may find their coop. It is a busy weak: 1. the IMF meets; 2. the FED meets and is expected to agree on a new twist to things (essentially manipulate long term interest rates to reduce them); and 3. the European finance ministers meet to decide on whether to release Greece's next allotment of cash.
Can you hear the clucking?
The Financial Times of London described the different scenarios of a Greek default(first three graphs). The written text following (and you may need a magnifier glass to read this) shows the actual events that took place in Argentina after it defaulted. The events were very traumatic for the middle class.
It would be very comforting to know that the Europeans worry about the people of Greece and try to stave off default for that reason. The truth is that Europeans worry about "contagion." Contagion, like quantitative easing, is a code word used to cover up what really goes on. In the case of "contagion," it refers to the check kiting that went on between European banks to allow governments to engage in deficit spending without admitting it. The next to last chart shows the tangled cross borrowing by European countries and their Central Banks. If Greece defaults, the European banks would have to write off a lot of their assets and they are close to bankrupt as is. Of course, the Europeans can do what banks do when dealing with fiat currency: print more.
At present, Europeans are trying to dump the Euro and buying US Dollars. That is why the Dollar is rising in value. The last graph shows us the resistance of the Dollar to buying pressure. Bernanke does not want the Dollar to rise; in fact he wants the opposite.
One might ask what brought Europe to this state. The application of Social Democracy is certainly a major factor, but the Greens is another significant factor. "Greens" means higher energy costs and higher costs in manufacturing. Governments borrowed money to maintain "benefits." And Europe is running out of other people's money to redistribute.
Saturday, September 3, 2011
Gold breaks out on upside.

 The last post uncovered a wedge formation both, in the plot of gold and also HUI (the miners index). This time I am reporting that both Gold and HUI have broken out of the wedge on the upside. The MACD's are very bullish for both. This time, the move in gold is confirmed by the move in HUI. In fact, the HUI 50 DMA has crossed the 200 DMA on the upside, which is also very bullish. Note also that the miner index has surpassed the value it had in April. Thus, we are beginning to re-establish the pre-April 2011 pattern of the miners moving up faster than gold.
Let us discuss now several issues related to the gold price.
Issue #1. Larry's calculations predict gold prices of $5,000 in the time frame of 2013-2016. This would mean that O'Bummer got re-elected in 2012 and he succeeded in destroying the US dollar and economy. I do not believe that this will happen. I believe that we will follow that 1980 scenario, O'Bummer will get defeated and gold will hit its high between now and 2012 Summer.
Issue #2. Larry's formula predicts that gold will not hit 2,100 till way into next year. My calcs show gold hitting 2,100 sometime in September and October.
Larry said that if gold hits 2,100, it will then head into the next up phase.
Issue #3. KWN reports that customers now want direct delivery of gold and the bouillon banks can not influence that. In fact, there is not enough gold to go around and the shortage will show up in fast price rises and the breakout of the gold and silver mining stocks.
Thursday, September 1, 2011
Gold at inflection point.


 Gold may be at a what some people refer to as an 'inflection point.' In this case it means that gold prices are poised to start changing at a faster rate. This can be seen both on the chart that depicts gold on a weekly basis (top graph) and on a daily basis (second from top graph). Looking at gold price on a shorter basis (third graph), we see a wedge formation that indicates a coming change. The same wedge pattern can be seen in the Index that tracks the PM miners (HUI, last graph).
We are in the early phase of the new trend (i.e. faster change in gold prices), so Analysts wait for confirmation. There was a breakout of gold on the upside then a very fast drop to 1,700, which was partially reversed during the same day. A same day reversal in price is a very bullish sign. Then gold began to trade sideways around 1,820 and is now poised to move out: either up or down.
What would drive gold prices upward? On the European side of the Pond, German Chancellor Merkel has caved on the issuance of EuroBonds, which is the European version of our QE. The FED is about to meet in September and it is anticipated that some form of QE will be announced. In the meantime, Obama is to announce a new jobs program of maybe as much as $1.6T and even if the cowardly Republican pare that to half, it will add that much to the deficit and the National Debt.
The new Obama jobs program is a purely political gimmick. Government spending is counted as part of the GNP, so adding that much spending is designed to create the perception that we are not in a recession. It is a re-election gimmick by Obama. While, Obama and the Media may fool the Country and the cowardly Republicans, they can not fool the Market. Gold is going up. Gold miners will go up.
Saturday, August 27, 2011
Gold bull enters different phase.

 The gold bull market entered a new phase. Large swings will be coming and downswings will be fast. We have seen this already. Gold price was down over $200 in three days (to $1700 in fact) before gold recovered and went up $130 in three days. Both, the up and the down phases have been faster. All eyes will be on the gold market Sunday night and Monday morning. Silver has not yet moved much.
The gold miner index corrected only about 5% while gold corrected over 10%. The expectation is that gold miners will outperform gold 3 to 1.
KWN expects gold to test $2000/oz during September and hit $2,100 by the end of the year. With the newer, faster moves of the gold market, these levels seem entirely possible and even within a shorter time span.
Friday, August 19, 2011
Changing patterns.


 One of the more interesting face of the PM market is the sequencing of events. Look at the first graph (the PM miners) and you see a downtrend in prices. This is supposedly due to shorting by hedge funds and will result in a shorts squeeze when the miners break out.
The second graph is that of silver. Silver has been heavily shorted and manipulated, but it has been in an ascending (but slow) pattern. Silver has closed above $42 today, which chartists believe will lead to a rapid rise in silver.
The third graph is that of gold prices. Gold has broken out of its normal trading channel and is beginning to rise at an accelerating pace (even more apparent with the MACD). Gold has wiped out a lot of shorts above 1,680, but is believed to be propelled now by the entrance of retail investors.
We can expect a sequence of breakouts: gold first, silver second and miners last.Experts expect silver to blast through fifty to set a new, all time record. Gold is expected to move past $2,000, but it is not clear what will happen then. Some forecasters see a government interference at $2,100, some at $2,300. Considering that we have a lawless President, who refuses to defend and enforce the Defence of Marriage Law or the Immigration Law, one hesitates to guess what this criminal will do to restrain the gold rally.
Subscribe to:
Comments (Atom)
