Tuesday, March 30, 2010

The beginning of a slippery slope.

The eerie resemblance between Nikolai Ezhov (Stalin's favorite executioner) reminds us that totalitarian regimes need a bogeyman. Stalin had several Bogeymen: the kulakhs (landed peasants), Trotskyites (code name for Jewish Communists), intellectuals (also a code name for Jews but in the academia), class alien elements (former capitalists) and deviationists from the Party line.

Obama's henchman, Janet ("Big Sis") Napolitano, may yet have ambitions to become the Ezhov to Obama. "Big Sis" has already told us of how she regards "right wingers" as enemies of the State, especially, former military men. The operation against Hutaree is an example of how a budding dictatorship begins its work: first it picks on an weak and unknown group untill real opposition to it coalesces and then it attacks to subdue the people.

Hutaree is an obscure group in Michigan, consisting of 2 or three families, totaling nine people. They are allegedly a Christian militia, organizing for the end time against the antichrist and Muslims. Perhaps "Big Sis" feels that this is aimed at Obama. It is alleged that the group planned to kill cops and attack the funerals to provoke an uprising against the government. No Christian group would plan murder, especially in such an unworkable plot. The government's charge smacks of a jimmied up excuse to begin subduing the populace. As a Michigan Democrat said, it will take time to put in the mechanics of controlling people.

The other method of a repressive government is to produce intolerable acts which the government has to put down. One such was the report by government whores in the Press that the Tea Party was threatening Congress. Ask yourself why the black members of Congress decided to walk through demonstrators instead of taking the customary buses to the Capitol entrance. The conclusion is obvious: the Obama regime tried to manufacture an excuse to move against the Tea Party people. The alleged cause was that a demonstrator was spitting on a black Congressman. Video shows that the demonstrator was using his hands as a megaphone and shouting, not spitting. Equally phony was the allegation in the Press that another Congressman was threatened by people putting a coffin on his lawn. The truth is that demonstrators were praying for him and the coffin was representing the thousands of babies that will be killed by ObamaCare paying for their murder in the womb.

The government used armed personnel carriers and helicopters to attack members of Hutaree. The picture of government agents attacking citizens not guilty of any crime is a chilling reminder of what the Obama regime may become.

Saturday, March 27, 2010

How long will Americans tolerate Obamanomics?


Bank lending is finally leveling off. Of course, the government is a competitor, because banks rather lend to the government at zero risk. If a bank borrows money at 0.25% interest and the govt pays the bank 3% or so for borrowing it, it's a led-pice cinch who will be the borrower.
But, the issue is more complicated than just the government fattening some of the banks. The very failure of Keynesian economics is being proven right in front of our eyes. Look at the second graph down. It tells us of the efficiency of money borrowed in terms of economic growth. We see that Keynesian spending to stimulate the economy has gotten less efficient over the years untill during the Obama regime a dollar borrowed and spend by the government actually reduces economic growth. The reason is because the Obama regime destroys segments of the economy and borrows the money to "rescue" it. Thus, no economic growth is possible.
The key to economic growth is energy consumption and generation. The estimated energy use in the world will increase most rapidly in emerging Asia (third graph down). In fact, we see that China is increasing oil consumption rapidly even now(fourth graph). OPEC nations have increased oil use by 50%.
The US could produce synthetic petroleum from natural gas with present technology, but the Obama regime is against using cars. While the regime pretends to favor alternative energy, the DOE has turned down loan guarantee requests for for the building of the American centrifuge by USEC or geothermal power plants by RZ and HTM. Even the supposed support for electric cars is phoney. While, the DOE has granted some $200M for researching electric motors, RZ had produced an electric Hummer with an efficiency of 100 miles per gallon of gasoline used. Since, pick up trucks comprise 40% of the vehicles in the country, using Raser's electric motor could reduce oil consumption by close to 30%. But, what the regime is after is not producing more energy and more growth, but to make us a poorer country where people are dependent on the government. And the regime has managed to put a third of the construction industry out of work.


Thursday, March 25, 2010


There are ways and tricks to make it appear that water flows uphill or that something defies gravity. Usually, there is a simple physical explanation. This is not to deny the possibility of miracles. One such an instance of something unusual, like water flowing uphill, is the current increase in the value of the dollar (top graph).
Why do we expect the value of the dollar to decline? Because more is being "printed" by whatever form. And this will not let up.
The next graph shows the state of Social Security. It now pays out more out than comes in. But, the deluded believe that there is a Social Security Trust Fund set aside, so it is secure, is it not? Unhappily, NO. Congress spent the money as fast as it came in and put in Treasury bills in its place. Those are simply IOUs. For a few months, the interest from the Treasury Bills will cover the cost, but not for long. In a year or so, the Treasury will have to sell Treasury bills not only to finance the deficit, but also to finance Social Security outlays. In other words, Social Security is broke, six years sooner than anticipated.
The average Democrat believes that the US can continue indefinitely with selling more Treasury Bills and live off IOUs. That belief is no longer justified. The last Treasury auction was to raise $42B. Sales were slow, so the govt had to increase the amount of interest it pays on the Treasury bills in question (5 year bills). This reduced the value of 5 year Treasury Bills by 25/32. The process of rising interest rates has begun. It will go on during inflation.
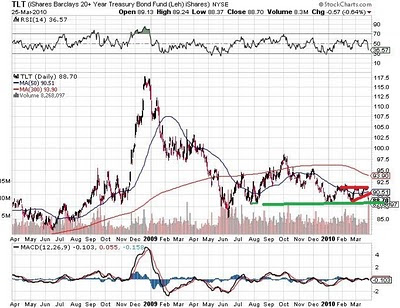
The next graph shows the latest on the 20-year Treasury Bill. Note that while the dollar began to rally, the TLT showed a head and shoulder (forecasting an upside move). This did occur and we saw an upside trading channel that lasted a short time. Yesterday and today, TLT broke out of this channel on the downside and signals that it will test the 78.5 level again, for the fourth time. So, the Treasury Bill data does not confirm the rise in the dollar.
The final graph shows the value of GLD, the Exchange-traded gold fund. GLD has successfully predicted the rise in gold prices beginning Sep 1, 2009 by describing a reverse head and shoulder pattern. GLD is once again predicting an increase in gold prices; this time twice as large as the one that occurred in 2009.
So, what is making the dollar rise? Are my fellow evangelical Christians correct that Obama is the Antichrist, who is supposed to fix the world's economy? Sorry folks. This is not yet the end times and Obama is simply an economically ignorant Leftist. But, what is driving the dollar is a "race to the bottom" by the dead beat nations of Europe and the dead beat United States. Greece is a bankrupt nation and unless it is bailed out, it will default with dire consequences for the Euro. Portuguese debt has been downgraded and Portugal will soon tell us that it needs a bailout. After that there is Italy, Ireland and Spain then England. US debt is still AAA, but in danger of being downgraded. When that happens, the Obama regime will have to start "monetizing" i.e. print Treasuries and buy it. What is happening is not that the dollar is becoming more valuable, but that it is losing its value slower than European currencies. It is now winning the race to the bottom. But, not for long. Treasury prices and yield tell the story. Gold will rise and add about $500 beginning in about 30-45 days.

Sunday, March 21, 2010

Gold about to break out?


Last year August, I spotted the flag formation for gold and reported when gold broke out on the upside. Gold broke out on September 1 and went to 122x dollars an ounce. Then it formed a downward trading channel and broke out of that pattern toward the end of February. This can all be seen in the last graph; the actual plotting of the price of an ounce of gold.
From the technical standpoint, it is easier to forecast gold prices from the GLD figures. GLD is an exchange traded bouillon fund. The first graph shows GLD forming a reverse head and shoulder
in 2009 prior to its breakout. The size of the head went from 89 to 94 and the advance in actual gold price was near $250/oz.
The second figure shows GLD recently. It is again doing a reverse head and shoulder. The size of the head goes from 104 to 112, which, using the proportions from 2009, would imply an increase of over $400/oz of gold or a top gold price of $1,500/oz. This, coincidentally, is the top price for 2010 that is predicted by the Cycle Theory. So, look for GLD to hit near 120 and gold to hit $1,500/oz.
The next graph down shows the divergence between GLD and TLT (20 yr Treasuries). TLT is tracing a head and shoulder formation. Though this form is difficult to analyse, it forecasts a drop in treasury note values.
The last figure is gold price. Even that shows a reverse head and shoulder, though the right shoulder is only halfway complete.
The fundamentals are that Greece needs 20-30 billion Euros to refinance its debt and they don't have it. While, Europeans talk about bailing out Greece, it is not happening.


Saturday, March 20, 2010

Economic recovery is a sham.

Who says that? None other than former Labor Secretary (a certified Liberal) Robert Reich, writing in the Huffington Post. Reich refers to the economic numbers of the Obama regime as "smoke and mirrors." He further cautions that the billions of the "stimulus" are happening at the cost of increased national debt that will have to be repaid in the future. So far, this stimulus has been used mostly to prop up State government unions and other, favorite pork barrel projects.

What about the economic "growth" toward the end of 2009? Smoke and mirrors there, too. Third quarter "growth" (originally reported as 3.7%) has been revised three times by now to 2.2%, due almost all to government spending. Fourth quarter growth has not been revised yet, but it was due to govt spending and some inventory buildup.

THERE IS NO ECONOMIC RECOVERY!

Saturday, March 13, 2010

Golden relationships.

It is readily evident, is it not, that many of the things this blog looks at are related. For instance, gold price and the dollar tends to change in reciprocal manner, inflation (monetary) is related to the change in money flow and money supply and the value of bonds goes down when inflation picks up. But, price inflation is modified by the economy: bad economy can reduce price inflation and so can deflation.

The Obama regime is seem to be bent on reproducing the Great Depression. Beginning with the change in the accounting system on Sep 15, 2008 (which stopped the financial system, put us into an instantaneous recession and electod Obama), the deflation has been used to mask the underlying inflation. It is also being used to selectively bankrupt companies which are then "rescued" and taken over by the government. As Van Jones (an Obama appointee and member of the Communist Party) had said, the goal is to destroy the Capitalist system of economy.

The destruction is done carefully, so it is not fast enough for the public to see and always is blamed on Bush. The FED tinkers with the accounting rules as recently pointed out in an article in Seeking Alpha by Ron Hera (Bernanke's Dilemma: Hyperinflation and the US Dollar). The FED then can control the rate of deflation by targeting part of the economy for destruction and bankruptcy.

There is a downside of deflation for the Obama regime. It puts the pressure on European Socialists and their schemes of ever-increasing national debts. In turn, the flow of European currencies into the dollar has created the illusion that the dollar is still a trusted currency. I suspect that the value of the dollar was artificially manipulated by our zombie banks as the coming rally in the dollar was announced in Seeking Alpha, which seems to have connections to financial circles. This rally in the dollar may be coming to an end which will lift the price of gold. While, the dollar has been topping out, gold has broken out of its downward correction. The 300 Day Moving averages tell the tale: the dollar remains in a bear market, gold is still in a bull market and the 300 DMA of 20-year treasuries has turned negative.

Bernanke's dilemma is that in order to sell treasuries, the interest rates have to rise (which will threaten the economic "recovery"), or if the FED "meneytized" some three trillion dollars in treasuries, it risks rapid inflation. In an election year, inflation is more politically tolerable than another economic collapse.

The radicals in charge are stuck on two Chinese curses: 1. may you live in interesting times and2. may you get what you wish for.

Friday, March 12, 2010

currencies slide further as gold gains.


Much of the Western world is suffering from government overspending and impending inflation. Almost every Socialist govrnment in Europe has been stimulating its economy (or at least trying to) by lowering interest rates. The first graph shows the calculated interest rates in Britain and the value of British pound. We see the pound losing ground. When expressed in terms of gold, the Euro is losing its value as well.
The third graph down shows the value of US treasuries. They are also losing value because investers anticipate inflation. Look at the bearish head and shoulders pattern and the downturn of the 300 DMA.
The next two graphs show the US Dollar. The first graph is the graph of the last three years while the next graph shows the US Dollar over a shorter period of time. It is evident that the recent rise in the value of thedollar is now over. We are not surprised then to see gold ending its downward trend and beginning a skow rise.
We see then these trends solidifying as it is entranched.


Tuesday, March 9, 2010

The financial danger facing us.

There are two basic and very great dangers facing the financial system of America:

The first one is the continued default of real estate, now commercial real estate. Fully 7.1% of real estate loans are now in default and default rates will skyrocket. The reason is that real estate loan recepients usually pay interest only and almost half of the outstanding loans will become due later this year and next year. With the economy in the pits, commercial real estate loans that cover shopping centers, offices and other such items are simply beyond the means of businesses to pay. It is estimated that nearly 1,000 regional banks are in danger of going under.

The second danger arises from the "carry trade" in the dollar. This is the way it works: the FED makes loans to banks and hedge funds at 0.25% interest. Banks and hedge funds then use this money to buy Treasuries on which they earn 2.0-3.5% interest risk free. Naturally, banks and hedge funds would rather buy Treasuries than make loans to businesses. A good way you say to recapitalize banks? OH NO, NOT BY A LONG SHOT!! The banks are allowed to become leveraged and buy 10 to 30 times the amount they borrowed from the FED. Since, the banks can not buy all the Treasuries, the FED buys a hitherto secret amount. But, as the manufacturing of currency picks up, the value of Treasuries decreases and the FED has to increase the interest rate it pays on Treasuries, so there are buyers. But, as the interest rates on Treasuries increase, the government has to pay more interest on the debt. In addition, the rate of loss of value of Treasuries is faster than the rate of gain in interest paid to the banks and hedge funds and these in turn must raise capital to satisfy reserve requirements. This makes it even harder for business to borrow. The carry trade in Japan ushered in the lost decade of very small gain in their economy.

So, as the banks go belly up, the FED has to print money even faster to pay for the deficit and for financing the national debt. This will fuel very rapid inflation.

Certain pundits tell us to sell gold because it will drop in price. Even George Soros got into the act. But, he just bougth $75M worth of stock in NovaGold Resources, while Paulson got $100M worth of stock. Both got a 25% discount btw.

Signs of the times.


Today we see two early signs of coming economic developments: 1. a drop in the Stock Market and 2. the start of inflation. The signs of a drop in the Stock Market is shown by the price/volume non-confirmation. This occurs when the DOW advances in price, but volume is dropping. So, the volume is not confirming the increase in price, which signals a coming price drop.


The second trend spotter is the price of the 30-year and 20-year Treasury bill price. I have already analysed the 30-year T-bill and noted the head and shoulders (an indicator of coming price drop). This time, we can look at the 20-year T-bill and analyse it carefully. This graph also shows a mini head and shoulder, forecasting a drop in prices. There are a number of other features of this graph which are also important. These bills (which are actually bonds) have coupons attached to them which pay a flat price every year. When inflation threatens, the price of the t-bill falls, because the fixed return will be less valuable. Note that in July 2008, when rising oil prices threatened inflation, the 300 DMA and the 50 DMA had kissed as people were expecting inflation. As the financial system unraveled in the Fall of 2008, the 50DMA skyrocketed, because t-bills were considered the only safe investment. As the panic receded, t-bills began to drop in value. The 50 DMA actually fell below the 300 DMA in May of '09, signaling a long-term bear market in treasuries. An interim low of 85 on this scale was reached in June, followed by a recovery and a support level at 87.6. TLT has hit this level 3 times and is heading for it again. The significance of that is that when a market keeps bumping a price repeatedly, it will eventually break through. When it does, a further drop will follow.


Other numbers to watch is the gold price (currently in the low 1100) and the value of the dollar. As inflation takes hold, oil prices rise (it is at $82/bbl already) and the value of paper currencies will drop in relation to gold. The price of gold will be affected by deflation/inflation.